15th November 2018
During 2014 we released a short briefing that debunked some of the claims made about the innovative approach to drug policy taken in Portugal, where personal drug possession is not treated as a criminal offence, and health and harm reduction services have been significantly expanded.
We thought it might help to highlight the success of this health-centred approach by making a few charts that show the effects it’s had in a range of key areas. (When reading the time series charts, bear in mind that this approach came into force in 2001.)
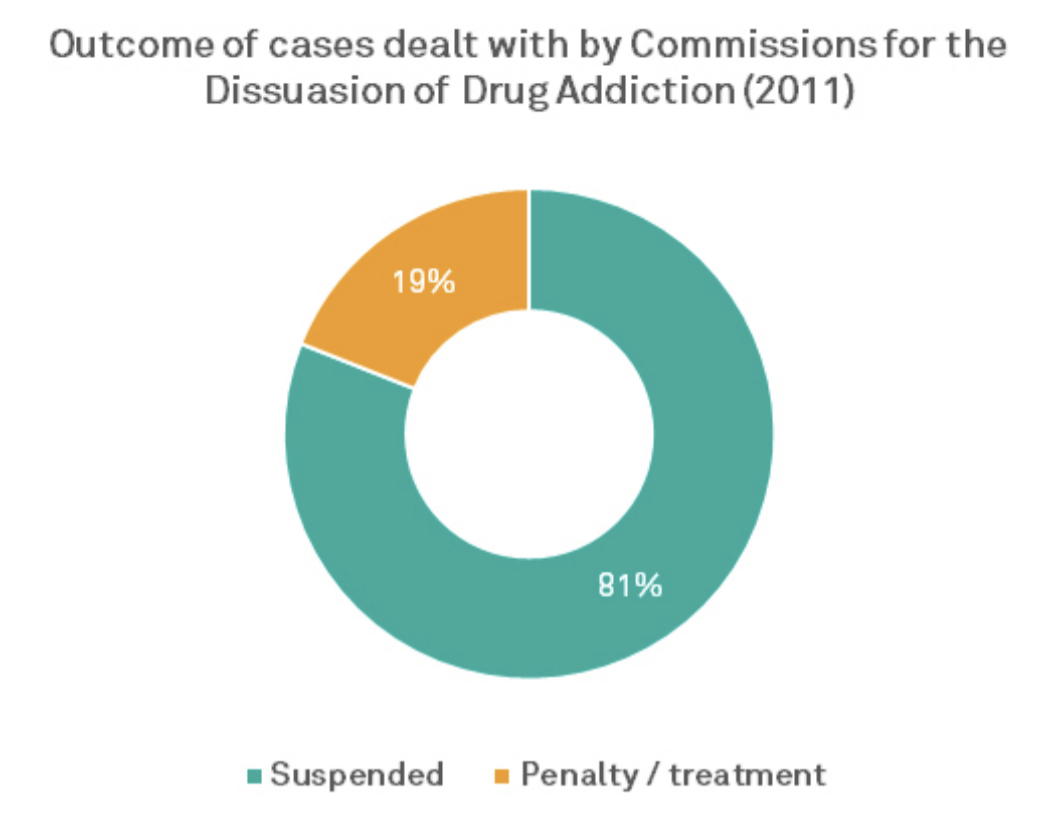
1. While personal drug possession isn’t a criminal offence in Portugal, it’s still an administrative offence, which means it can be subject to fines or other minor penalties. When people are caught with drugs, they’re often referred to what are known as ‘commissions for the dissuasion of drug addiction’, which decide what penalty (if any) the person should face. However, as this chart shows, the vast majority of people have their cases ‘suspended’ – i.e., no further action is taken.
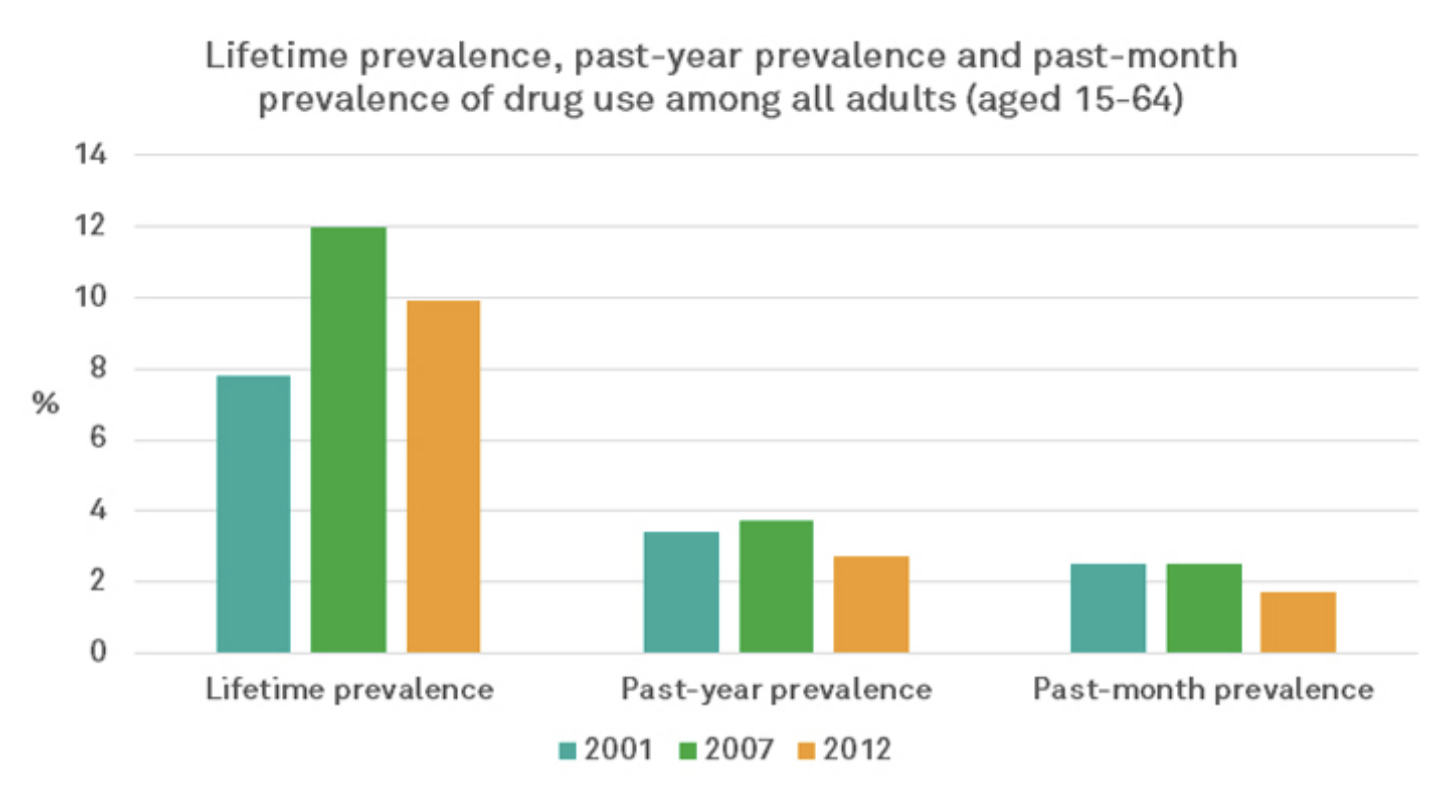
2. Despite virtually eliminating all punishments for personal drug possession, rates of drug use haven’t skyrocketed like some predicted. As this chart shows, use had gone up slightly when measured in 2007 (a trend in line with other, similar countries), but has since gone back down. In fact, by two out of three measures, adult drug use is now lower than it was in 2001. This gives more credence to the idea that criminalising people is an unnecessary (not to mention inhumane) way of trying to stop them taking drugs.
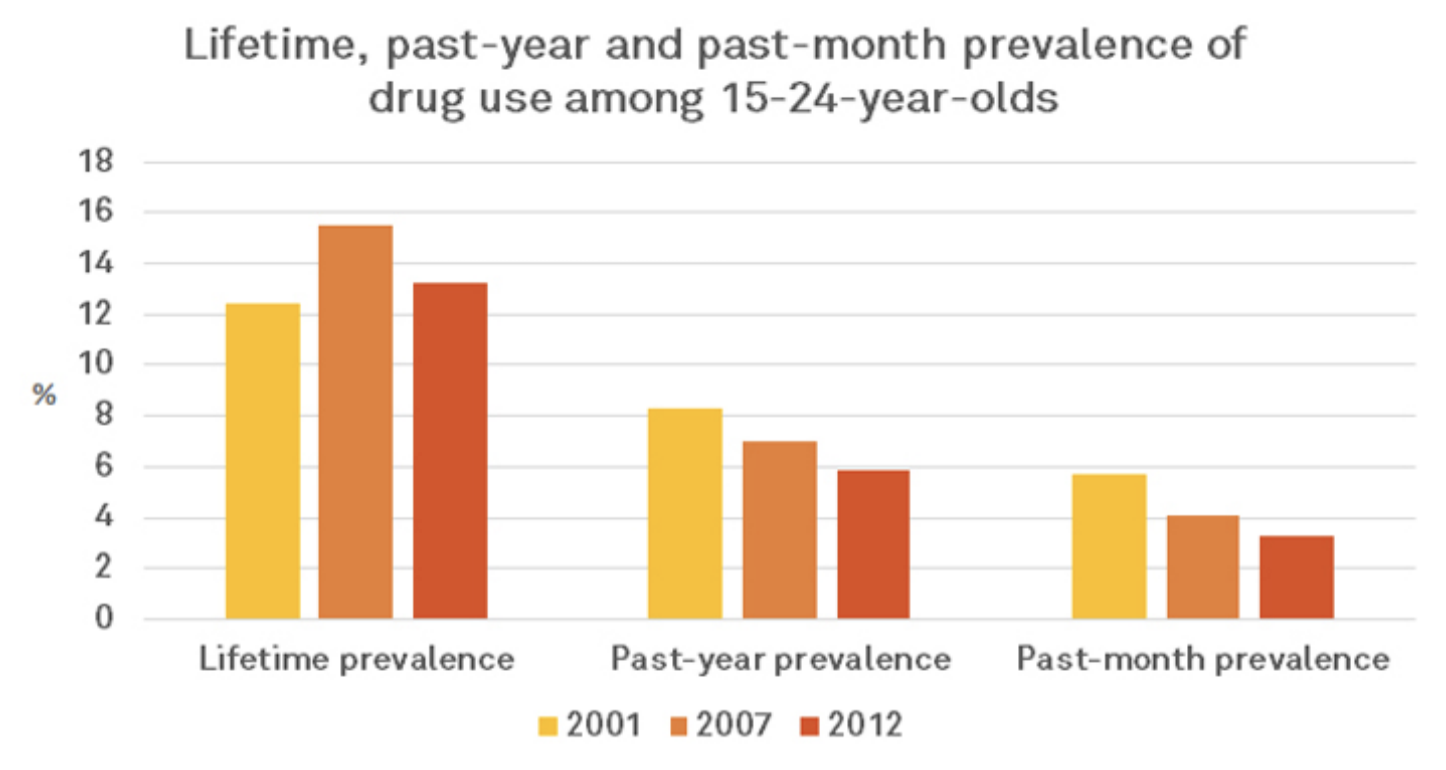
A similar trend can be seen among people aged 15 to 24, the population most at risk of starting to use drugs for the first time. (Incidentally, it’s worth pointing out that past-year and past-month prevalence are considered to be the best indicators of a country’s current drug use situation.)
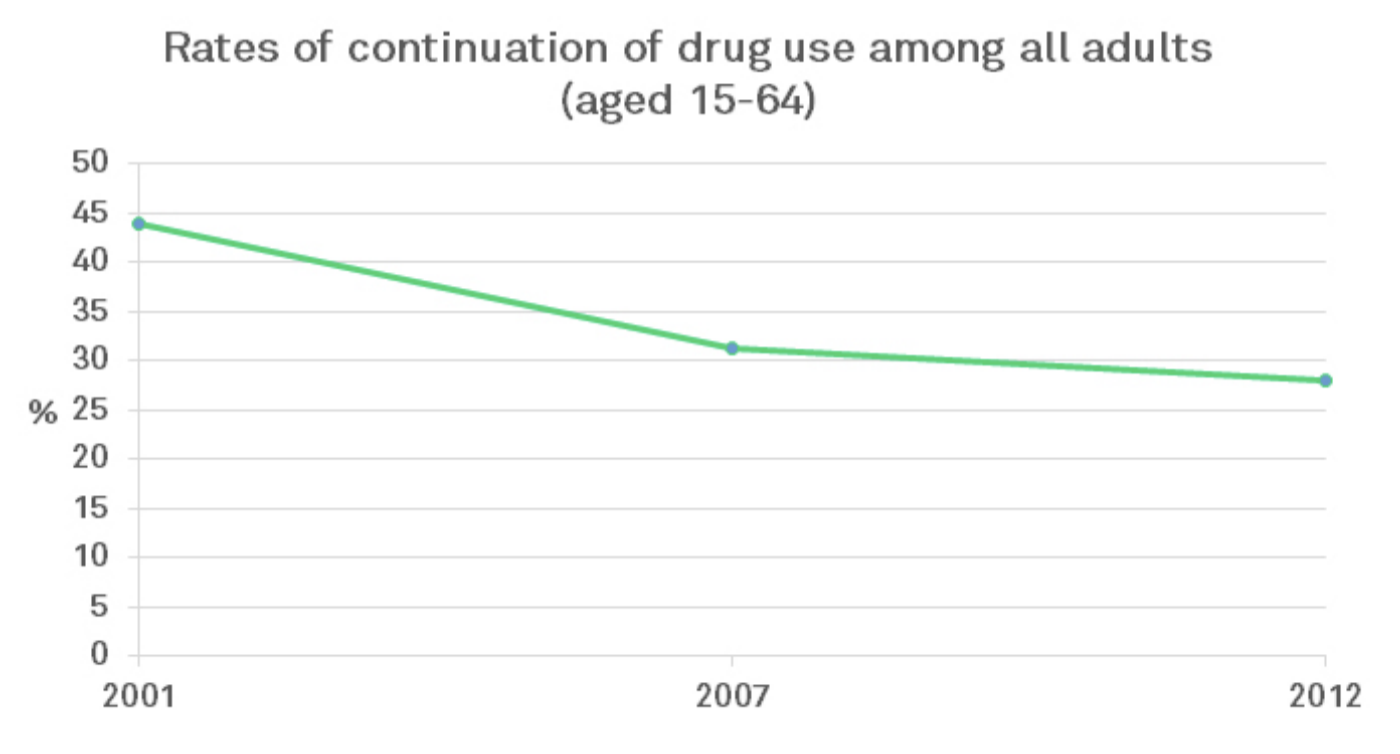
4. The apparent decline in rates of recent drug use among the general population is corroborated by a reduction in the proportion of the population who have ever used a drug and continue to do so.
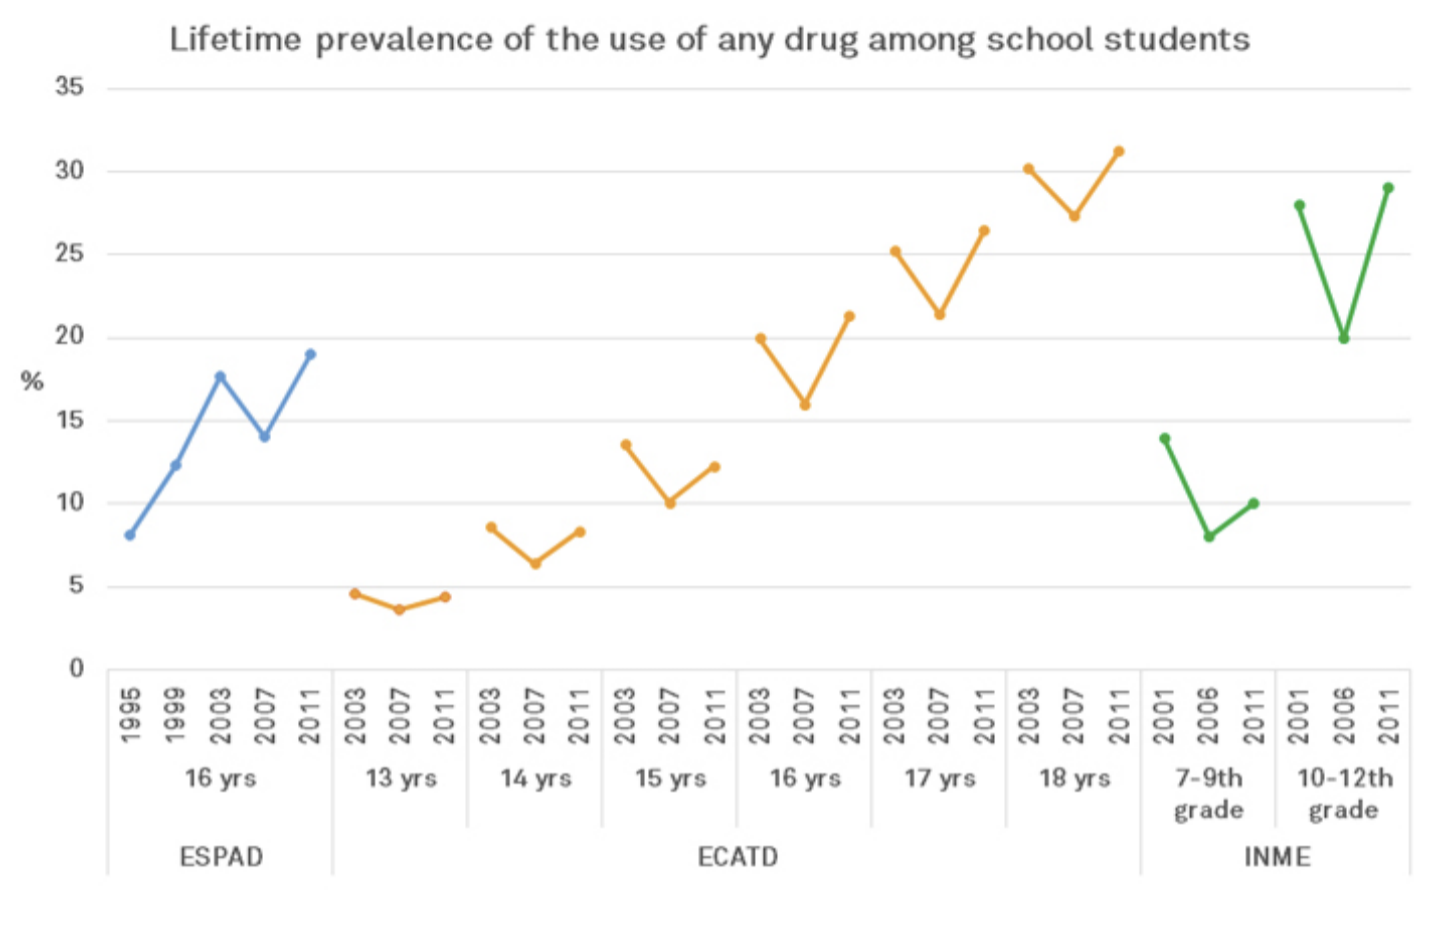
5. This chart shows the results of three different surveys that measure rates of drug use among school students. As you can see, each survey found that prevalence was in decline at least until 2007, which is a full six years after the decriminalisation policy came in to effect. Given this, the subsequent increase detected in 2011 is more likely due to social, cultural or economic factors, rather than the removal of criminal penalties for drug possession.
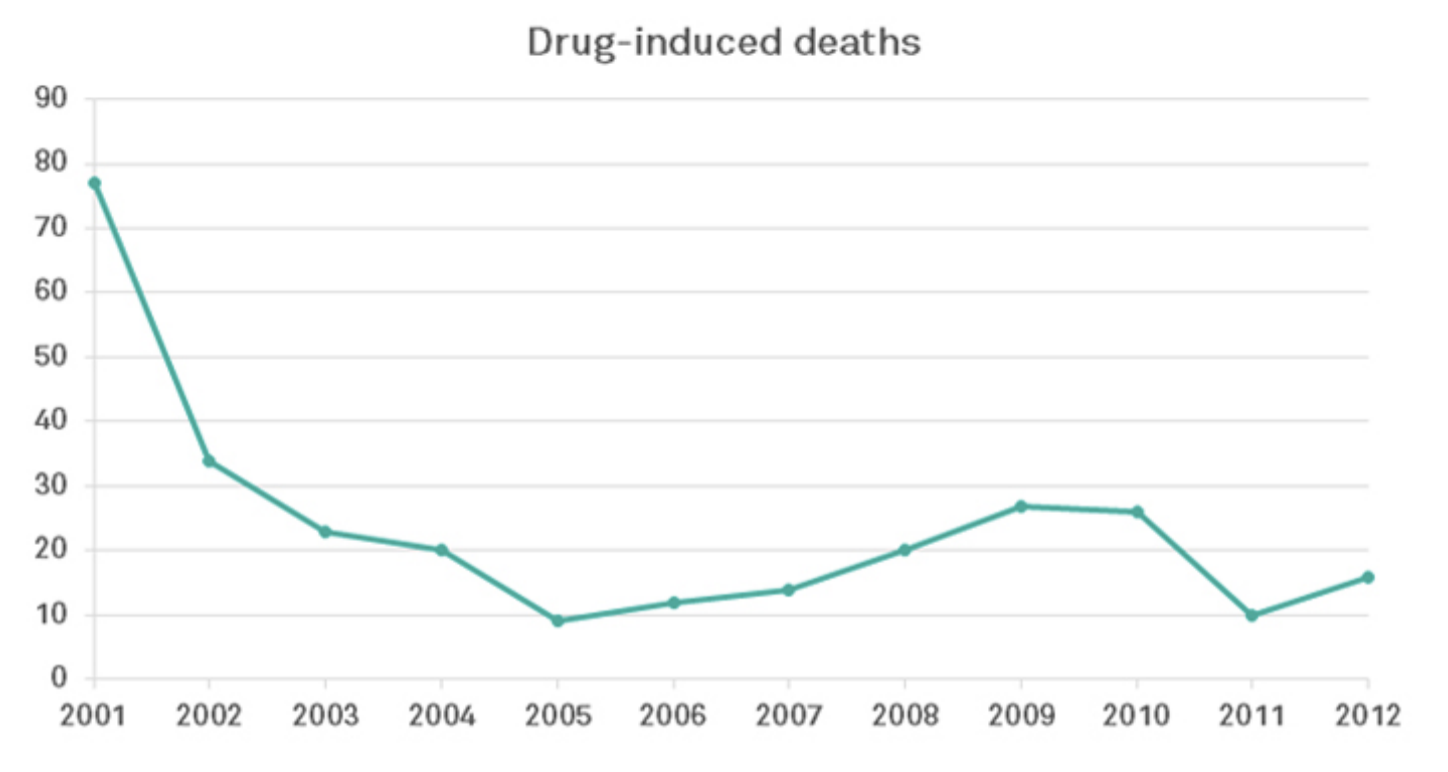
6. There’s often a fixation with prevalence of use as the main indicator of drug policy success, but it’s important to look at other outcomes that give a more accurate picture of levels of drug-related harm. The number of deaths caused by illicit drug use is a therefore a key indicator, and as this chart shows, they have decreased significantly since 2001. It’s important to stress that this decline is likely down to the expansion in harm reduction measures that accompanied the decriminalisation policy, not the decriminalisation itself. But the two obviously go hand in hand – it’s difficult to help and protect people who use drugs when you’re simultaneously criminalising them.
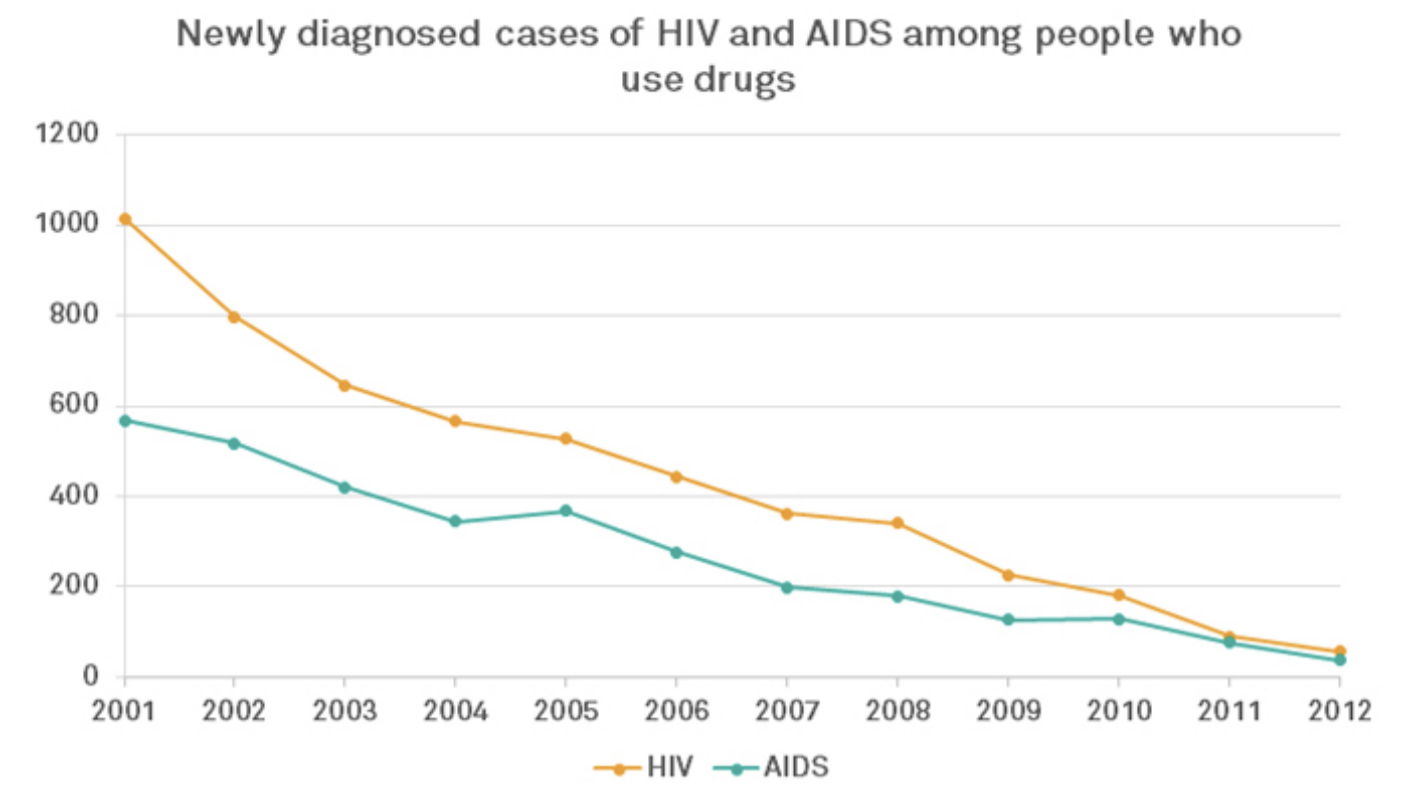
7. When Portugal introduced its progressive reforms in 2001, the country’s drug using population was in the midst of a public health crisis, with rates of HIV and AIDS rapidly increasing. The greater emphasis placed on harm reduction and treatment from 2001 onwards has helped reverse this trend. As this chart shows, there has been a huge reduction in the number of drug users diagnosed with HIV and AIDS.


